As of February 22, 2023
Many programs have contacted the CAPCSD Admissions Committee seeking information regarding admissions trends in CSDCAS this year, most often due to concerns regarding a decrease in the number of applications for their program. In response, we have conducted an analysis of the current state of CSDCAS applications at both the national and program levels. Our analysis concerned a “snapshot” of CSDCAS applications on 2/22/23 (from the current 2022 – 2023 cycle) and, as a point of comparison, CSDCAS applications on 2/22/22 (from last year’s 2021 – 2022 cycle); here we refer to the former as “this year” and the latter as “last year.”
At the national level, 10,758 unique applicants submitted at least one application for SLP programs this year, a slight increase compared to the same time last year (10,664). A similar pattern was observed for AUD programs, with 1,048 unique applicants this year and 971 unique applicants last year. Overall, 34,883 applications were submitted to SLP programs this year, reflecting a decrease of 5.2% compared to the 36,801 applications submitted at the same time last year. For AUD programs, 3,522 applications were submitted this year, an increase of 8.8% compared to the 3,236 applications submitted at the same time last year. The number of applications submitted by each applicant has remained relatively stable over the past two years; it is also rather consistent across SLP and AUD applicants. This year, the median number of applications submitted by SLP applicants is 3 (mean = 3.24, SD = 2.39) and the median was also 3 last year (mean = 3.45, SD = 2.56). For AUD applicants, the median number of applications was also 3 both this year (mean = 3.36, SD = 2.41) and last year (mean = 3.33, SD = 2.45). The past two years are consistent with historical data; for example, the median number of applications submitted per applicant was also 3 in the 2018 – 2019 cycle (SLP: mean = 3.51, SD = 3.14; AUD: mean = 3.14, SD = 2.19).
Though the national-level view provides critical information for tracking large-scale admissions trends in our professions, it does not necessarily provide an optimal point of comparison for individual programs. For example, the number of existing programs that use CSDCAS generally increases every year, entirely new programs may be created each year, and some programs do not admit applicants every year. Because national-level trends do not directly map to program-level effects, we conducted an analysis to examine program-level changes in the applicant pool. This analysis was limited to a subset of SLP (n = 183) and AUD (n = 51) programs that used CSDCAS both this year and last year and that had similar deadlines each year. For each program, we calculated the percent change in applications this year relative to last year. For example, if a program received 90 applications this year and 100 applications last year, then this would reflect a -10% change in applications this year relative to last year. Likewise, if a program received 110 applications this year and 100 applications last year, then this would reflect a 10% change this year relative to last year.
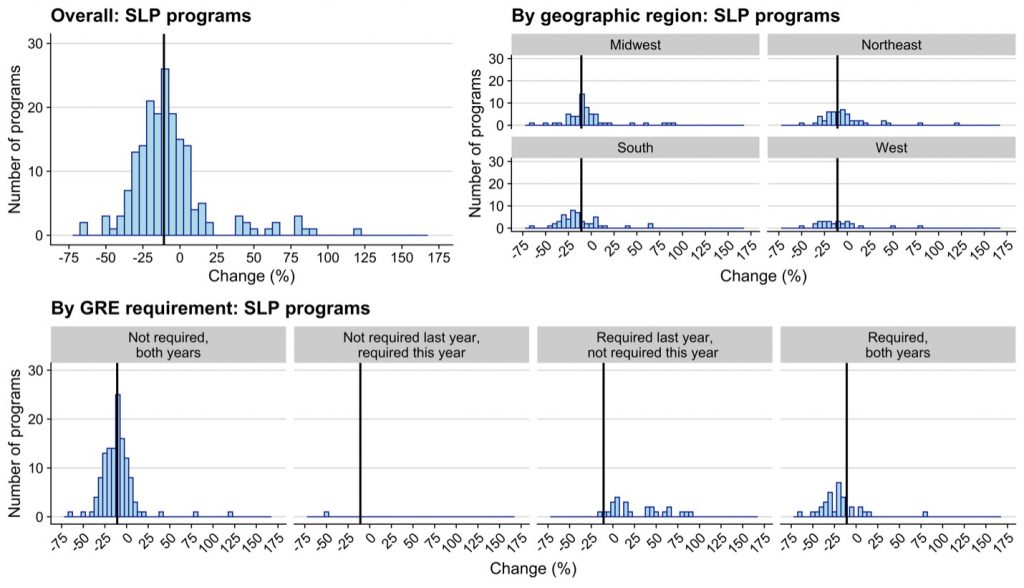
Consider first the results for SLP programs. As shown in Figure 1, there was wide variability in the change across programs (range = -62.7% - 120.0%). Overall, the median change across programs was -10.8% (mean = -7.1%, SD = 27.1%). Of note, most SLP programs (75.4%) showed a decline in applications, and the average decline of these programs was -18.2% (SD = 12.7%). Of the 24.6% of programs that showed an increase in applications, the average increase was 27.0% (SD = 31.1%). To examine factors that may be linked to the overall variation in application change, we analyzed program-level change by geographic region and use of the GRE. The top right panel of Figure 1 suggests that program-level change was relatively consistent across geographic regions. In contrast, the bottom panel of Figure 1 suggests that GRE use exerted a non-negligible influence on application change. Specifically, programs that had consistent use of the GRE both years exhibited a distribution of change consistent with the modest decline observed among most programs, whereas programs that required the GRE last year but did not require it this year showed a striking increase in applications.
Figure 1. Histograms of percent change in applications for SLP programs from the current year (2022 – 2023) compared to last year (2021 – 2022) in the aggregate, by geographic region, and by GRE requirement. In all panels, the dark vertical line indicates the median change across all SLP programs.
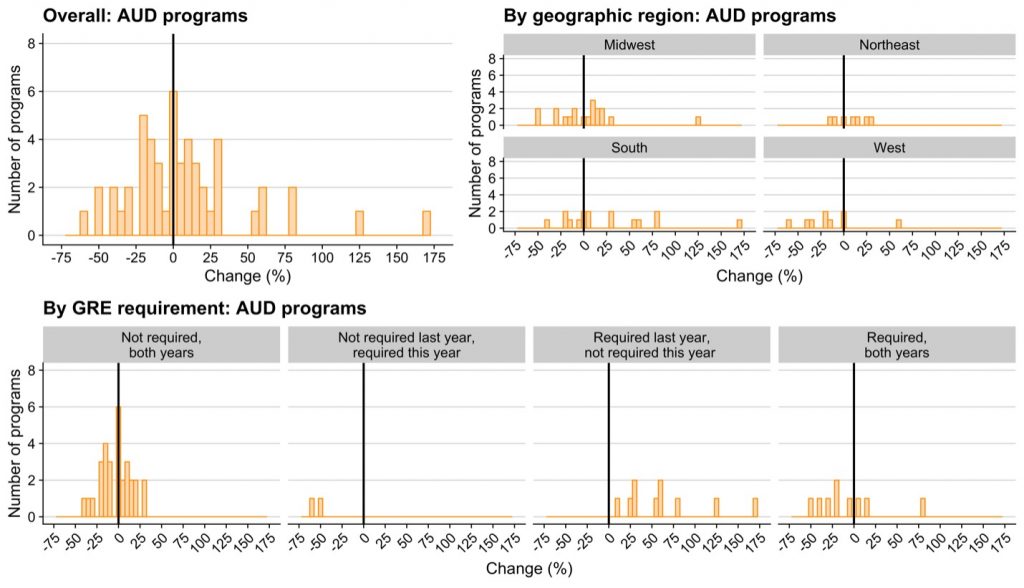
Now consider the results for AUD programs. As shown in Figure 2, we again see wide variability in the change across programs (range = -58.3% - 171.8%). Compared to SLP programs, the median change across programs (0.00%) was more stable (mean = 7.9%, SD = 41.9%). However, AUD programs were rather evenly split such that 50.9% of programs showed a decline in applications and 49.1% of programs showed an increase in applications. Of those that showed a decline, the mean decline was steep (-19.9%, SD = 16.7%); likewise, those that showed an increase observed a steep mean increase (26.8%, SD = 40.9%), though we note substantial variability in present for both cases. The top right panel of Figure 2 shows program-level change across geographic regions and the bottom panel of Figure 2 shows program-level change as a function of GRE use. As was observed for SLP programs, programs that dropped the GRE requirement this year after requiring it last year showed the largest increase in applications.
We hope that this glimpse of the current state of applications in CSDCAS is helpful to programs as they evaluate their current admissions cycle. The CAPCSD Admissions Committee will perform a parallel analysis at the close of the 2022-2023 cycle, which will be distributed to programs at that time. Given the relatively stable number of unique applicants and number of applications submitted per applicant over the past two years, the increasing number of newly developed programs may contribute to a decline in applications for existing programs. Without an increase in number of unique applicants in the national-level pool (or an increase in number of applications submitted per applicant) – and the expectation that new programs will continue to be developed in the coming years – programs may be wise to anticipate a decline in applications for future admissions cycles. The CAPCSD Admissions Committee is currently working to curate resources that may help programs offset such a decline (should this be desired), including materials that may help to recruit out-of-major applicants to the CSD fields.
As always, please don’t hesitate to reach out if we can be a resource for your admissions needs.
Respectfully submitted,
Dr. Rachel M. Theodore
CAPCSD VP of Admissions
vpa@capcsd.org
Megan Woods
Director of Centralized Admissions
mwoods@capcsd.org


